Application Security Coverage

The Overlooked Metric in AppSec: Coverage Ratio
TL;DR: Most enterprises only deeply test a small fraction of their application portfolio — often as little as 7%. Coverage Ratio measures how much of your attack surface is tested, how often, and how deeply. By tracking breadth, frequency, and depth of testing as a unified metric, security leaders can quantify blind spots, justify budget, and strategically reduce risk across their entire software estate.
Security teams often pride themselves on sophisticated testing and low false-positive rates, but there’s a critical question that too often goes unasked: What percentage of our application portfolio are we actually securing? Consider a scenario where an organization has 1,000 applications, yet due to limited AppSec resources it can only thoroughly security-test about 70 of them – a mere 7%. The remaining 93% might get only cursory attention or rely on developers’ ad-hoc efforts, with no concerted security focus. This imbalance is more common than you might think. In fact, over half of security teams report “unmanaged” risks in their application portfolios, underscoring a substantial gap in effective security coverage.
Many industry discussions focus on security scanner accuracy or the improved quality of manual, expert-based testing but often do not consider how to deal with the long tail of applications and software products that have limited budgets for security testing. The core challenge today is achieving quality, speed, and affordability simultaneously. In the past, breaking the “quality speed cost triangle” required project teams to “pick two.” With the latest class of application security testing capabilities from Staris AI, your team can plausibly “pick three” and get on with resolving that backlog of unmitigated software.
Coverage Ratio as a Key AppSec Metric
It’s time for security leaders to start tracking Coverage Ratio: a metric that captures how much of your software estate is under effective security testing. Coverage should be treated as a first-class metric alongside counts of vulnerabilities or scan quality. Coverage is the portion of software attack surface examined, its examination frequency, and its thoroughness.
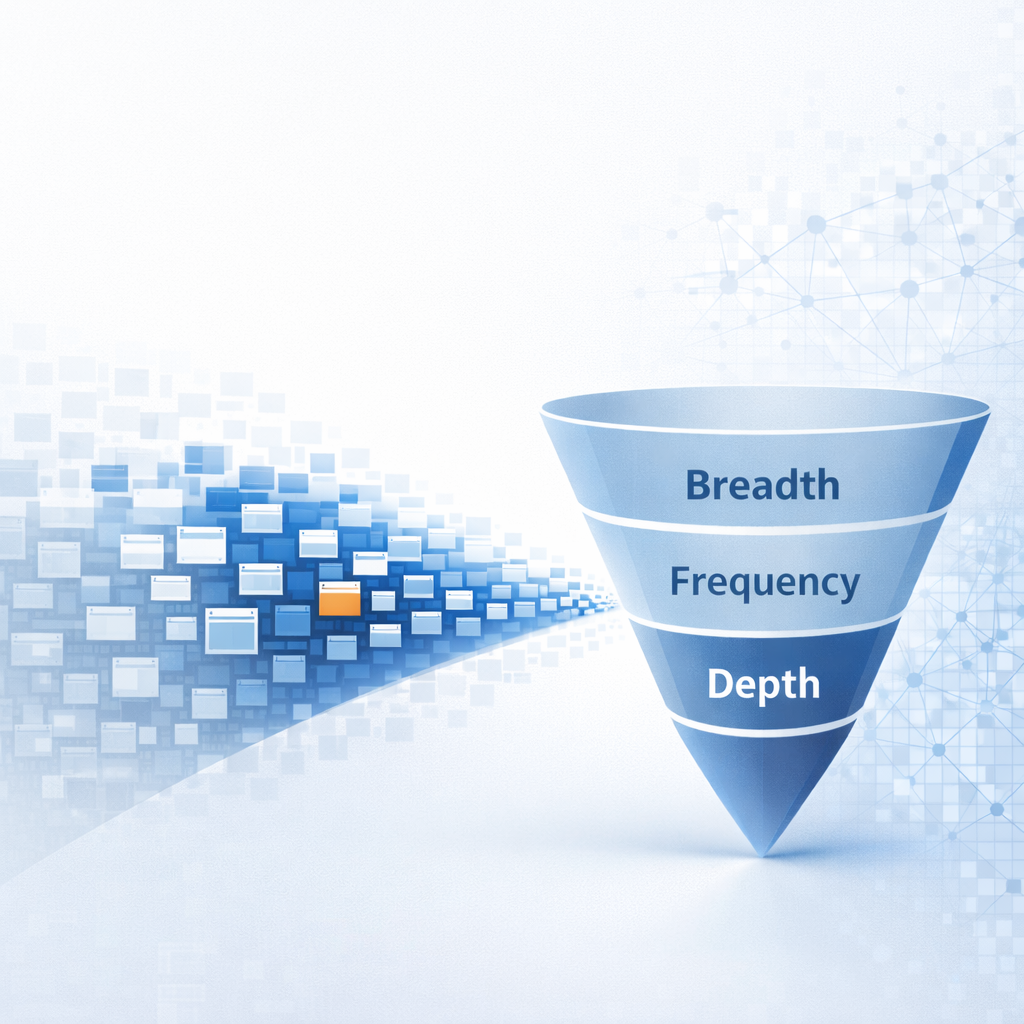
We can break this down into three dimensions of coverage:
- Breadth of Coverage (Attack Surface Coverage): What fraction of the assets are tested? This could be the percentage of applications that undergo security review, or the percentage of code/functional areas within an application that are tested. For example, testing 70 out of 1,000 apps yields only 7% breadth – leaving 93% of applications with unknown security postures. Industry surveys show many organizations struggle here: a staggering 53% of teams admit to unmanaged risks in their app portfolios, indicating large gaps in coverage. Simply put, if large swaths of your applications are never tested, your security program is flying blind over most of its terrain.
- Frequency of Coverage (Testing Cadence): How often is each asset tested, relative to how often that asset changes or is deployed? An ideal scenario is continuous testing or testing every time an application is updated. In practice, many teams test infrequently – perhaps annually or quarterly – which means new vulnerabilities can linger unaddressed for long periods. One way to think of this factor is “days after publishing since last test.” Ideally this number is zero: you test an application immediately when it’s released or updated. The longer the gap, the more stale your assessment. A recent study found that 50% of organizations fail to test the security of their apps after each release. This is alarming when paired with data showing that once a vulnerability is made public or introduced, 25% of exploits hit on day one and 75% within just 19 days. In a world of continuous delivery, if your security testing lags weeks or months behind your development, you’re out of sync with attackers. Frequent, timely testing is essential to cover each new version of your software.
- Depth of Coverage (Testing Depth and Rigor): How thorough are the tests for each asset? Depth refers to the quality and comprehensiveness of the security verification. For instance, running a traditional automated scan provides some coverage but likely misses complex logic flaws. On the other hand, a full manual penetration test combined with source code review and fuzzing of critical components (or just one pass with Staris AI) would represent much deeper coverage. You might measure depth by the types of testing applied (automated vs. manual, dynamic vs. static, etc.), the extent of code or features reviewed, or the breadth of vulnerability classes addressed. Depth is important because a superficial test might only scratch the surface of an application’s risk. True security assurance for critical apps often requires diving deep.
Breadth, frequency, and depth together determine your overall coverage. In fact, vulnerability management experts note that strong test coverage must be paired with test frequency and depth to give a full view of risk visibility. All three are multipliers: if any one is lacking, the effective security coverage drops.
Formulating a Coverage Ratio (The Coverage Equation)
How might we quantify these concepts into a single metric? One approach is to create an equation for Coverage Ratio that multiplies the three factors (each expressed as a unitless ratio between 0 and 1). For example:
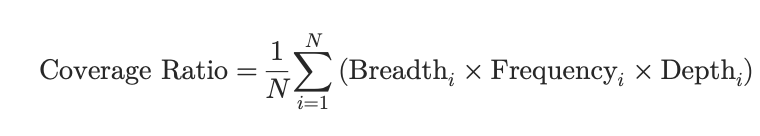
This formula is a simplification, but it illustrates the idea. The Breadth term measures the portion of your environment under security scrutiny (for instance, 0.07 if 70 out of 1000 apps are tested). The Frequency term is one way to penalize staleness – here expressed as an inverse of “days since last security test after deployment.” In this formulation, if an application was tested immediately upon its latest release (0 days delay), the frequency factor is 1 (optimal). If it’s been 30 days since release and no security test, the factor would drop to ~1/31 ≈ 0.032, indicating the coverage for that app rapidly decays over time. (One could also use a different scale or threshold – the key is that longer gaps reduce the score). Finally, the Depth term represents how exhaustive the testing was, relative to an ideal maximum. An application that only had a quick automated scan might get a low depth score (say 0.2), whereas one that underwent a full battery of manual and automated tests might be at 0.9 or 1.0.
By multiplying these, we get a Coverage Score for each application, or an aggregate score for the program. If an app isn’t tested at all, breadth is 0 and thus coverage is 0. If it’s tested but not after its latest updates, the frequency factor drags it down. If it’s tested often but only superficially, the depth factor limits the score. The product thus captures the intuitive idea that true security coverage requires covering many assets, often, and well. A deficiency in any dimension leaves risk on the table.
Let’s apply this concept to the earlier scenario of 1000 apps where only 70 get full attention. Suppose those 70 critical apps are tested in-depth (depth ≈ 1.0 for those), but only once a year on average, and they have frequent releases. Their frequency factor might be very low (imagine major updates occur monthly, but security tests yearly – at worst, an app could go ~300 days untested post-release, frequency factor ≈ 1/301 = 0.003). Meanwhile, the other 930 apps might get almost no dedicated security testing (breadth near 0 for those, aside from perhaps some basic scans integrated by development teams). The overall Coverage Score for the organization would be shockingly low – essentially highlighting that perhaps only a few percent of the total attack surface is being actively secured at any given time. This quantitative view puts a spotlight on the often-overlooked risk: the vast unmitigated attack surface lurking beyond the crown jewels.
Low Coverage Creates Hidden Risk
Focusing only on a handful of high-risk applications and ignoring the rest can create a false sense of security. Yes, it’s crucial to harden your most critical apps, but attackers will pivot to softer targets in your environment – and those lesser-known apps can be a gateway to your crown jewels. We’ve seen this pattern in breaches: an attacker compromises a seemingly low-priority system and then moves laterally. If 93% of your apps are largely untested, that’s an enormous attack surface ripe for exploitation. As one security leader put it, organizations often have a “long tail” of apps that have been in production for years with little oversight. These legacy or lower-profile systems can accumulate critical vulnerabilities simply because no one is looking.
Data from the field reinforces the urgency of broadening coverage. A WhiteHat Security report found at least half of applications in 11 different industries had serious vulnerabilities exposed every day over a year . In sectors like utilities and government, two-thirds of apps were essentially “always vulnerable.” Why? It’s not that those organizations lack scanners or skilled testers – it’s that the coverage wasn’t there. Many of those flaws persisted because the applications weren’t being tested and fixed regularly, if at all. The effort (patching, mitigation) naturally lags where there is no visibility. Simply increasing the number of apps under test led some organizations to initially report more vulnerabilities, which sounds bad until you realize it meant they were finally shining light on previously dark corners. In one case, a wave of ransomware attacks forced companies to expand testing to legacy apps, uncovering latent vulnerabilities and eventually prompting fixes. The lesson is clear: untested apps are Schrodinger’s risk – they likely harbor vulnerabilities, you just haven’t observed them yet. And as long as they remain unobserved, they remain unaddressed.
Another often-neglected aspect is alignment with development cycles. Modern DevOps teams might deploy updates weekly or even daily. If your security team assesses an application only once a year, the coverage is out-of-date almost as soon as it’s completed. The fastest-moving organizations (think tech and finance leaders) have recognized this and strive to integrate security testing into the CI/CD pipeline, effectively testing continuously or with each release. These teams manage to fix critical vulnerabilities within days or weeks, dramatically shrinking the window of exposure. On the flip side, organizations that stick to infrequent testing and slow patch cycles end up with an ever-growing backlog of issues and an “always vulnerable” profile for many apps . The frequency component of coverage is therefore key to keeping pace with both attackers and developers. If your testing cadence doesn’t match your deployment cadence, your coverage metric is signaling a major gap.
Improving Your Coverage Ratio without Breaking the Budget
Admittedly, achieving 100% coverage across thousands of applications, tested deeply and continuously, is a daunting goal when considering finite budgets and a shortage of skilled AppSec professionals. The goal of the Coverage Ratio metric isn’t to shame security teams for not covering everything, but to quantify the risk blind spots and drive strategic decisions. Even if you can’t immediately cover everything at maximum depth and frequency, you can use the metric to justify improvements and smart allocation of resources. Here are some strategies to consider:
- Build Capacity: Coverage ratios are a quantitative way of tracking what we already know, which is there are just not enough skilled expert AppSec testers available to keep pace with the demand for security testing. To build capacity teams should look not just to automate more of the testing work, but also to find automations that allow more of the work to be run simultaneously.
- Increase depth: If a software product has 150 APIs but each API takes a whole day to accurately discover vulnerabilities, validate them and report the findings, then a time-boxed test won’t have enough time to complete testing of all the APIs. This inherently means that some APIs will be deprioritized or skipped entirely. The solution is to apply capacity through automation to allow not just more products to be assessed but also to increase the depth of the assessment to include 100% of all software features.
- Allow for more frequent testing: Capacity also allows more tests to be run simultaneously, thus eliminating queues or backlogs of tests waiting to be executed. To enable more frequent testing that aligns to the development release cycles, cybersecurity teams should also employ automation that completes each test much faster so that each test can be run within the release cycle or very shortly after release.
- Automate remediation: Automating remediation is not only about producing working code to patch proven vulnerabilities, but also to automatically prove the remediation work needs to be done in the first place. This means that any vulnerability reported to a development team should include: a) the vulnerability b) proof of exploitability c) steps to reproduce the exploitation d) a proposed remediation.
- Lower the marginal cost of additional testing: Many software teams have limited software maintenance budgets, limiting the total security budget that can be applied to testing and remediation. Through experience, our team has found that as the cost of testing is lowered, the demand for testing goes up. This is simply because there are many software products that are not being tested today due to a lack of capacity but also due to unaffordable testing options.
- Continuous reporting and improvement: Using coverage ratios to track, report, and improve the capacity, quality, and frequency of testing is a useful way to iteratively improve software quality and monitor risks in software development. These metrics are meaningful to an audience beyond the security community and are easy to understand where residual risk may lie and what steps need to be taken to mitigate that risk.
Conclusion & Call to Action
In an era of increasingly complex IT environments and lightning-fast development cycles, coverage is the silent killer in security programs. If you have the best tools and talent in the world, but if they’re only applied to a fraction of your systems, the majority of your risk remains unmitigated. The concept of a Coverage Ratio brings this issue front and center. By examining how much of your attack surface you’re covering (and how well), you get a clearer picture of your true security posture. It’s not an easy metric to optimize – there are real constraints of budget, time, and people – but it provides a strategic target.
My challenge to CISOs and Product Security leaders: take a hard look at your own coverage. What percentage of your applications, APIs, or services are getting regular security attention? How long after deployment do they linger before someone checks their security? Are you aligning testing with each release, or are you months behind? Quantify it. These metrics reveal how much risk could be lurking unexamined.
From there, consider what steps will incrementally improve that coverage without simply “throwing money” at the problem. It might be integrating a new automated testing tool to run across all apps, increasing the frequency of testing, or systematically lowering the total cost of each test. Every organization will strike a different balance, but if you’re not measuring and consciously improving coverage, you are likely leaving the majority of your attack surface undefended.
In the end, sophisticated testing on 7% of your portfolio and ignorance of the other 93% is not a sustainable strategy. By instituting a coverage mindset and metric, you shift the conversation from “We found X bugs in these apps” to “We have Y% of our environment under control.” Don’t let the long tail lead to unmitigated risk. Expand your coverage, adjust your resources, and ensure your security efforts scale to the size of your real-world application footprint. Your security program’s effectiveness is not just about how you test, but how much of what you have gets tested. It’s time to measure that, improve it, and ask others to do the same.
Frequently Asked Questions
What is a Coverage Ratio in application security?
A Coverage Ratio is a metric that quantifies how much of your software attack surface is under effective security testing. It combines three dimensions: breadth (what percentage of apps are tested), frequency (how often they’re tested relative to releases), and depth (how thorough the testing is). Multiplied together, these factors give a single score representing your organization’s true security coverage.
How can I improve my application’s security coverage?
Start by measuring your current coverage across breadth, frequency, and depth. Then prioritize: expand breadth by bringing untested apps into scope using automation, increase frequency by integrating testing into CI/CD pipelines, and deepen coverage by using tools that find logic flaws — not just pattern-based vulnerabilities. AI-driven platforms like Staris can dramatically improve all three dimensions simultaneously.
Why do most enterprises only test a small fraction of their apps?
The primary constraint is capacity. Manual penetration testing is slow and expensive, and there aren’t enough skilled AppSec professionals to cover every application. Budget limitations, competing priorities, and legacy tooling that can’t scale to modern development velocity all contribute to the coverage gap.
How does Coverage Ratio relate to overall security risk?
Coverage Ratio directly correlates with visibility into risk. Applications that aren’t tested harbor unknown vulnerabilities — what this article calls “Schrödinger’s risk.” Research shows that once vulnerabilities are introduced, 75% of exploits occur within 19 days. Low coverage means longer windows of exposure across more of your portfolio, compounding organizational risk.